

At a Glance
- Late, but on time: on our count, more than one in three arrivals came one to six minutes late and would still count as on time under the contract’s definition. More than one in ten were later still.
- Your route: of the routes we ranked, the 261, 265 and 285 (all Busways) were late least often, about 7%; the 533 (16%) and 144 (20%) most. The 144 is often late before it reaches Lane Cove.
- Back to pre-COVID levels: lateness fell during COVID, then from 2023 to 2025 rose at about Sydney’s rate; faster here from 5pm to 7pm, slower in the morning peak.
- Early buses usually don’t wait: only five of the 224 Lane Cove stops we could test typically held one for more than a minute. So get to the stop a few minutes early.
- Counted, not published: operators of most Lane Cove routes report each route’s early, late and cancelled trips to Transport monthly. None is published. We counted about one trip in 100 flagged cancelled, 6 to 25 September 2026.
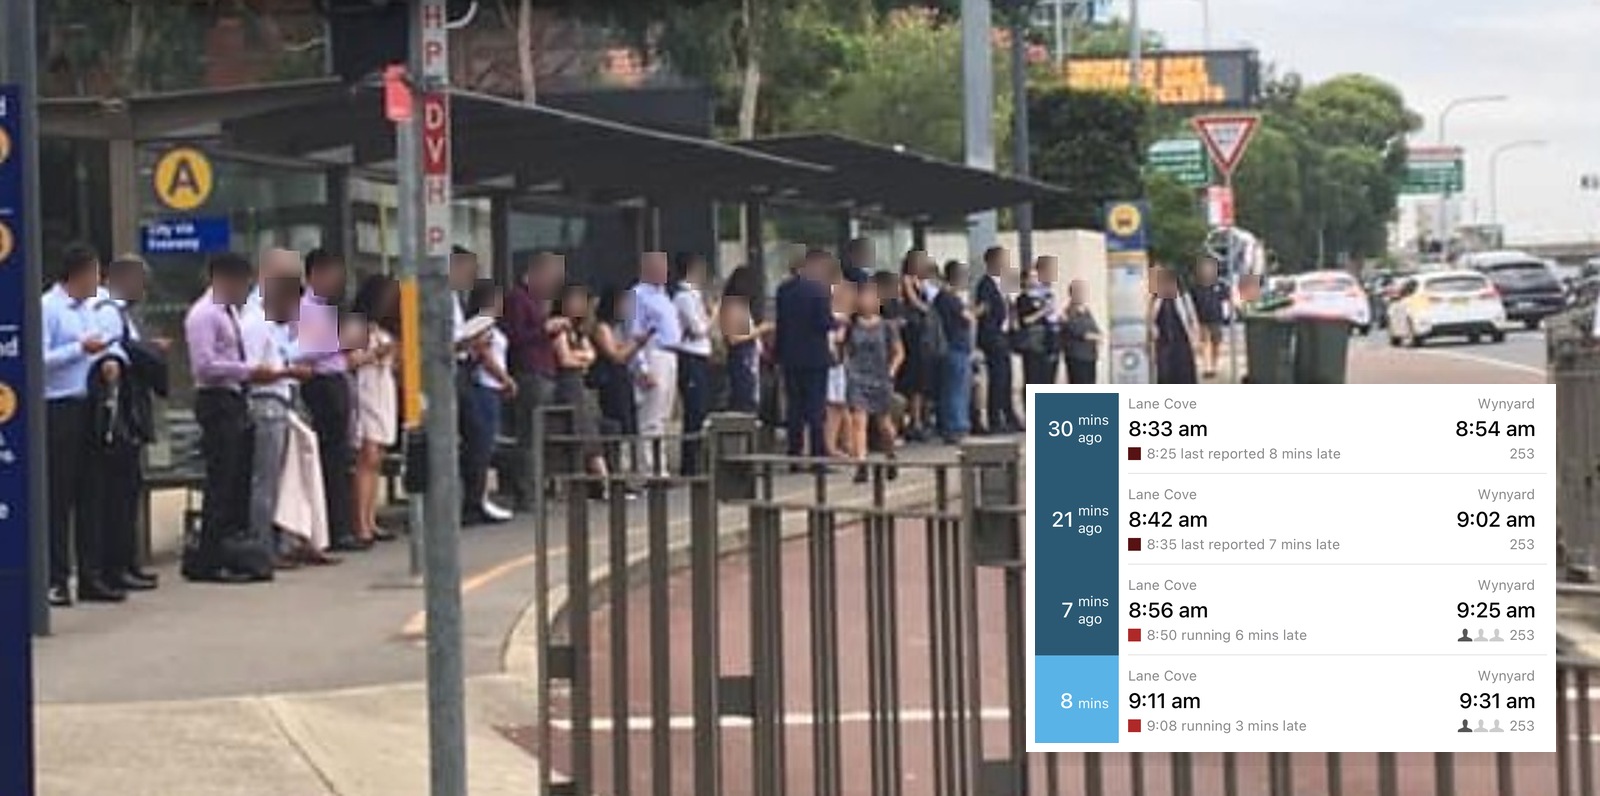
The departure board in our photo shows four route 253 buses to Wynyard, one after another on a regular weekday morning. It shows them eight, seven, six and three minutes late. Buses are a bugbear for many In the Cove readers, and this story started with one of you writing in.
By any ordinary meaning, all four are late. Under the contract between Transport for NSW (TfNSW) and the operator, a bus is on time from 59 seconds early to five minutes 59 seconds late. It is not late until it is six minutes behind.
So, technically, the three-minute bus would count as on time, and the six-minute bus sits right on the line. That matters in the Lane Cove LGA.
The train stations at St Leonards and Wollstonecraft sit just over the council boundary, and neither is convenient for most of Lane Cove.
Sydney Ferries calls at Greenwich Point every day, and a weekday Captain Cook Cruises service stops at Greenwich, Northwood, Longueville and Riverview.
For most of Lane Cove, the bus is the only public transport option.
In the Cove counted all 5.4 million recorded bus arrivals at every Lane Cove stop from June 2024 to May 2025. A bus reaching a stop counts as one arrival, so a bus is counted again at each Lane Cove stop it passes. That is the most recent full year we can use: since June 2025, Transport’s public data fills in missing arrival times with estimates, and since February 2026 its arrival times have come from a prediction model, so the latest months cannot show when buses actually arrived.
These are our own figures, not Transport’s official results, and our method differs from the one used to assess operators (see How we counted, below).
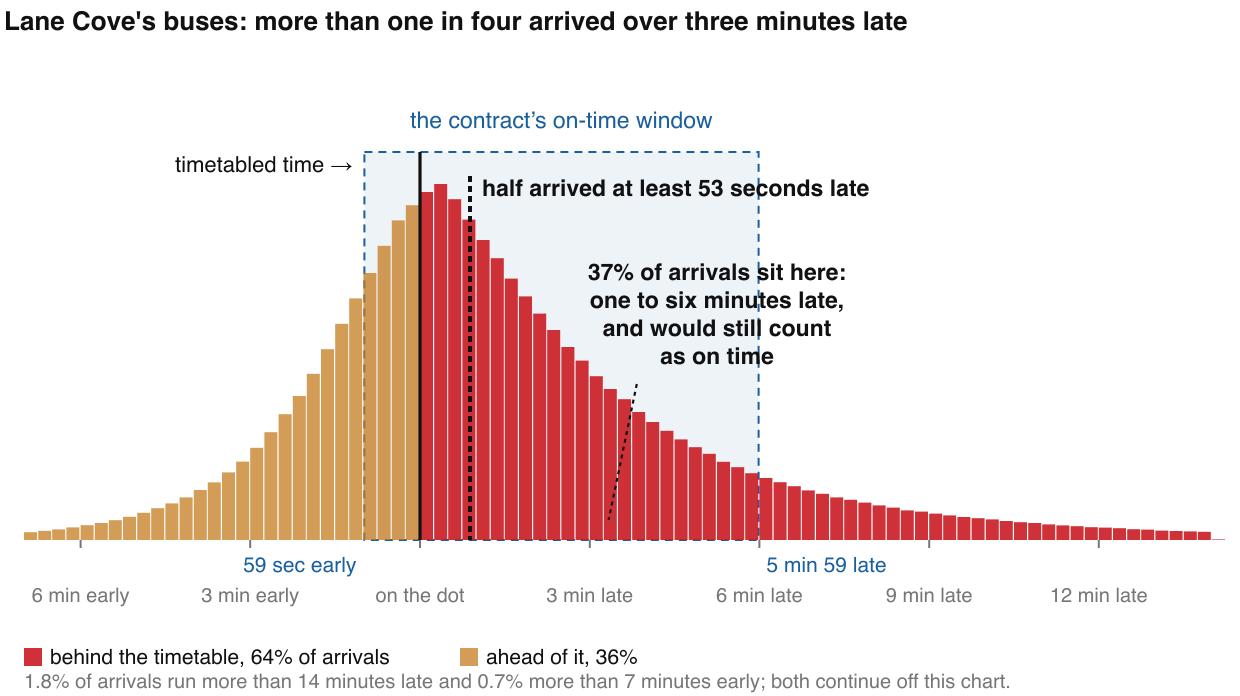
Two in three arrivals (67%) fell inside the contract’s on-time window, and about one in five (22%) ran early. More than one in three (37%) came one to six minutes after the timetable and would still count as on time. More than one in ten (11%) were later still.
A bus that leaves early strands anyone who arrived on time. The contract’s definition does not specify why it allows more time late than early. The Auditor-General has reported that punctuality is influenced by factors such as traffic congestion and patronage numbers, which operators have little control over.
Are the buses still running this late? Our figures stop in May 2025, and the timetables have changed since.
On 21 June 2026, Transport adjusted the timetables of several routes that serve Lane Cove, saying the changes were “to improve reliability”.
Busways, which runs most of Lane Cove’s routes, told us the new timetable for its region “included additional running time across the network”.
The public data can no longer show whether that helped.
Our own ten-day check in late September 2026, in school term, found about the same share of buses six minutes or more late as the same routes had over our recorded year. That year took in the school holidays, when fewer buses ran late, so we cannot yet say whether the new timetables helped.
How late is your bus?
We ranked the routes still running with at least ten trips a day, leaving out the 612X, whose recorded data is too erratic to rank. Of those, the 261, 265 and 285 were late least often, about 7% of arrivals, and the 144 most often, 20%.
Next came the 533 along Mowbray Road, at 16%. Most routes sat between 10% and 13%, including the 253 in our photo, at 12%.
School term is when it bites. On weekdays in term, 12.3% of arrivals on the regular (non-school) routes were six minutes or more late; in the school holidays, 6.8%.
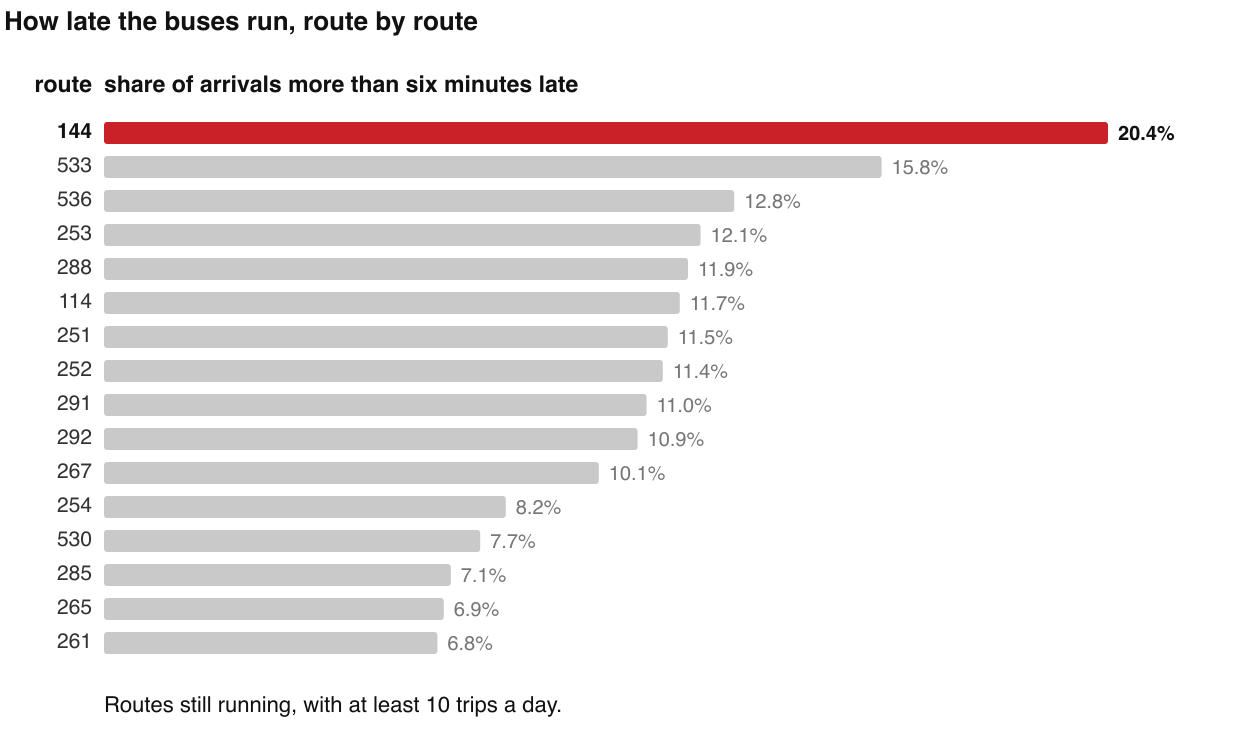
The contract’s definition of on time also fails a bus for running early, and the 530, which is late less often than most routes, ran early more often than any other ranked route (29%).
| Route | Late6+ min | Early1+ min | Tripsa day |
|---|---|---|---|
| 144Manly to Chatswood via St Leonards | 20.4% | 18.4% | 214 |
| 533Sydney Olympic Park to Chatswood via Rhodes & North Ryde | 15.8% | 13.2% | 84 |
| 536Gladesville to Chatswood via Hunters Hill | 12.8% | 26.1% | 20 |
| 253Riverview to City Wynyard via Freeway | 12.1% | 17.4% | 16 |
| 288Macquarie University to City Erskine St via Freeway | 11.9% | 16.8% | 119 |
| 114Balmoral to Royal North Shore Hospital | 11.7% | 14.5% | 120 |
| 251Lane Cove West to City Wynyard via Freeway | 11.5% | 12.1% | 20 |
| 252Gladesville to North Sydney | 11.4% | 25.1% | 71 |
| 291Epping to McMahons Point via North Sydney | 11.0% | 20.8% | 51 |
| 292Marsfield to City Erskine St via Macquarie Park, Lane Cove North & Freeway | 10.9% | 22.3% | 107 |
| 267Chatswood to Greenwich via Crows Nest | 10.1% | 19.6% | 42 |
| 254Riverview to McMahons Point via North Sydney | 8.2% | 25.0% | 38 |
| 530Burwood to Chatswood | 7.7% | 29.4% | 74 |
| 285Lane Cove West to City Wynyard via Freeway | 7.1% | 16.9% | 34 |
| 265Lane Cove to North Sydney via Crows Nest | 6.9% | 26.1% | 32 |
| 261Lane Cove to North Sydney via Longueville | 6.8% | 18.4% | 51 |
| Withdrawn in August 2024, not ranked | |||
| 320 | 4.1% | 38.4% | ran Jun to Aug 2024 |
Our analysis, not an official figure. Recorded arrivals at every Lane Cove stop, 5 June 2024 to 31 May 2025, ordered by the share six minutes or more late, worst first. All routes are Busways North West except the 144 and 114 (Keolis Downer Northern Beaches) and the 530 and 320 (Transit Systems West). Where each route runs is from Transport’s current timetable. Source: Bus Opal Assignment Model (Transport for NSW open data).
Most of the 144’s Lane Cove arrivals come on its inbound run, and on that run it has already made 32 stops by the time it reaches Lane Cove. At its first Lane Cove stop, 24% of its arrivals were already late; by its last, 18%. The 144 does not become late in Lane Cove. It arrives late, and fewer are late by the time it leaves.
Where are the official route figures?
TfNSW publishes punctuality by contract region, which it told us “aligns with the way bus services are contracted, managed and monitored across the network”.
Route-level performance information, a spokesperson said, “is used extensively to monitor operators, manage contracts and inform service improvements”, but “it is not currently published as part of Transport’s regular reporting”.
Schedule 5 of the contract requires the operator to report every month, for every route, the “number of published Timetabled Trips”, the “number of Cancelled Trips”, the “trips that are Early (Start/Mid/End)” and the “trips that are Late (Start/Mid/End)”.
The contract specifies that data “is and remains the property and Confidential Information of TfNSW”. The operator could not publish it without Transport’s consent. When we asked for route-level figures, Transport did not provide them.
Whichever bus you are waiting for, it has already been counted, just not anywhere you can see.
Why on time doesn’t feel on time
Nearly two in three arrivals (64%) came after the scheduled time, about one in six by less than a minute.
Buses also drift off the timetable as they cross Lane Cove, mostly by running early: of the runs we followed, 72% were on time at their first Lane Cove stop and 58% at their last.
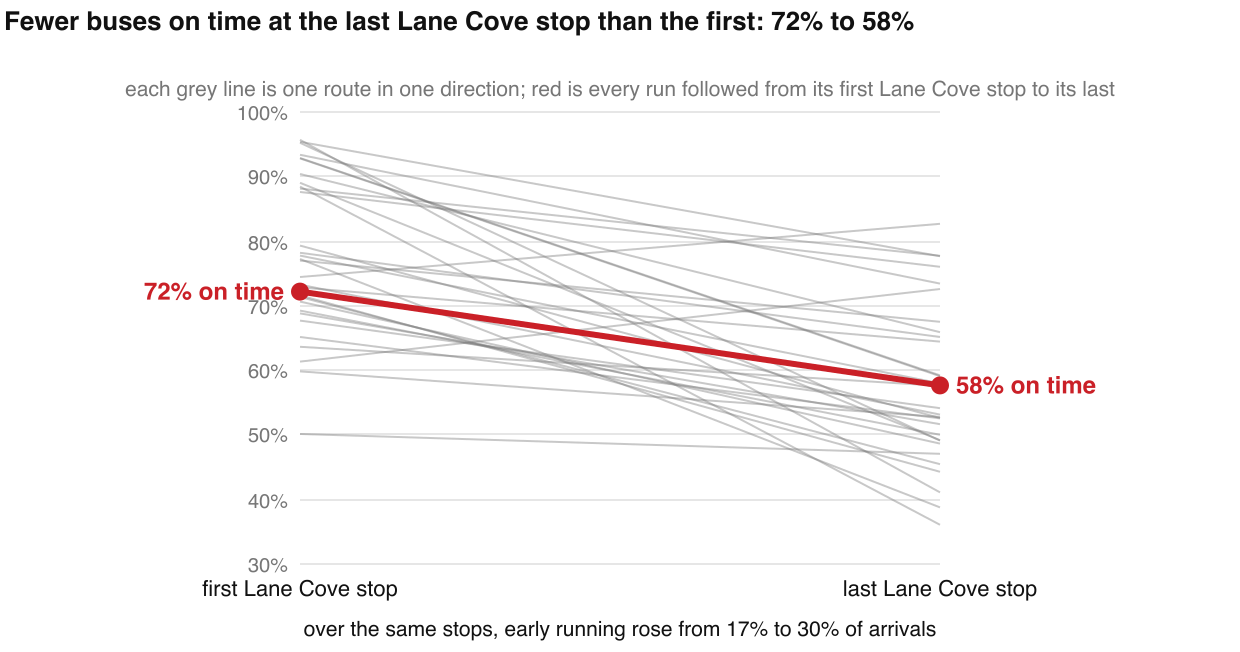
An early bus need not be a problem if it waits. Most do not. Of the 224 Lane Cove stops we could test, five typically held an early bus for more than a minute. Transport says drivers may be required to wait at certain stops, and does not publish which. So get to the stop a few minutes early.
None of this is about drivers. They drive to a timetable they did not write and cannot change, and the punctuality target is an obligation on the operator, not on the person at the wheel.
What Transport publishes
Transport publishes one punctuality figure a month per bus contract, against a 95% target. In the year to August 2026, Sydney’s ten contracts missed the target in 89 of 120 monthly results.
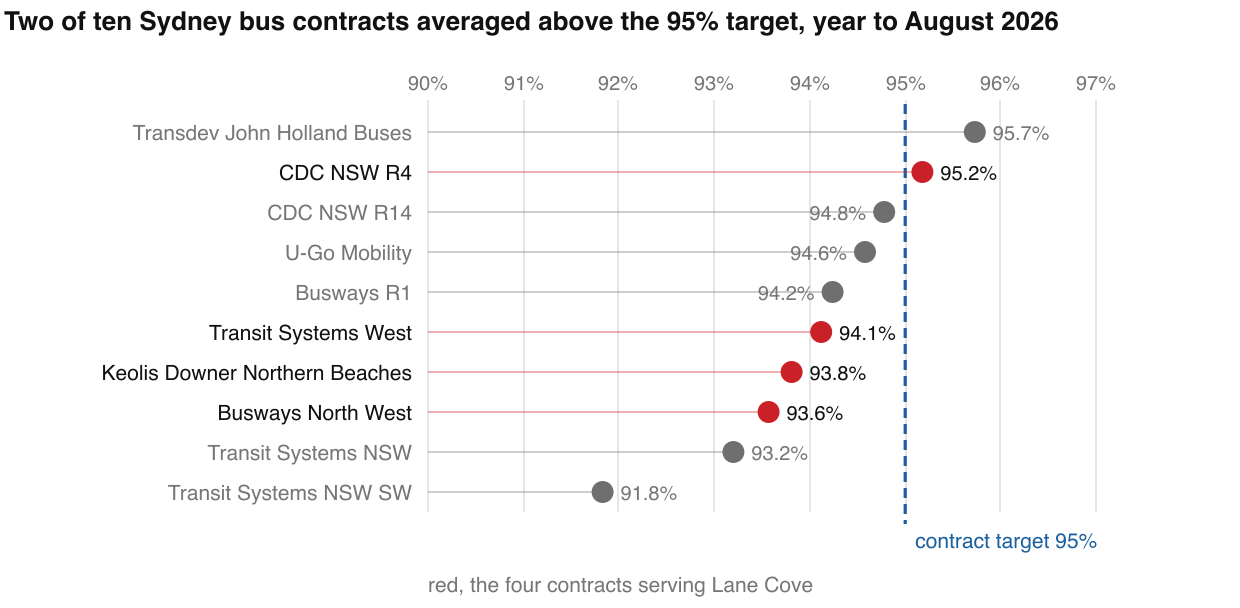
Region 7, Lane Cove’s main contract, run by Busways North West, came eighth of the ten at 93.6%. Only 1.6 points separate the four contracts with buses in Lane Cove.
Transport’s figure measures something different from ours, so the two should not be compared. It takes each bus once, as it leaves the first stop of its trip, and lets it leave up to a minute earlier than the contract’s 59 seconds; the contract itself assesses operators at set timing points along each route.
Transport told us it tightened its published definition of on time in January 2023. Every contract with enough figures to compare then scored lower.
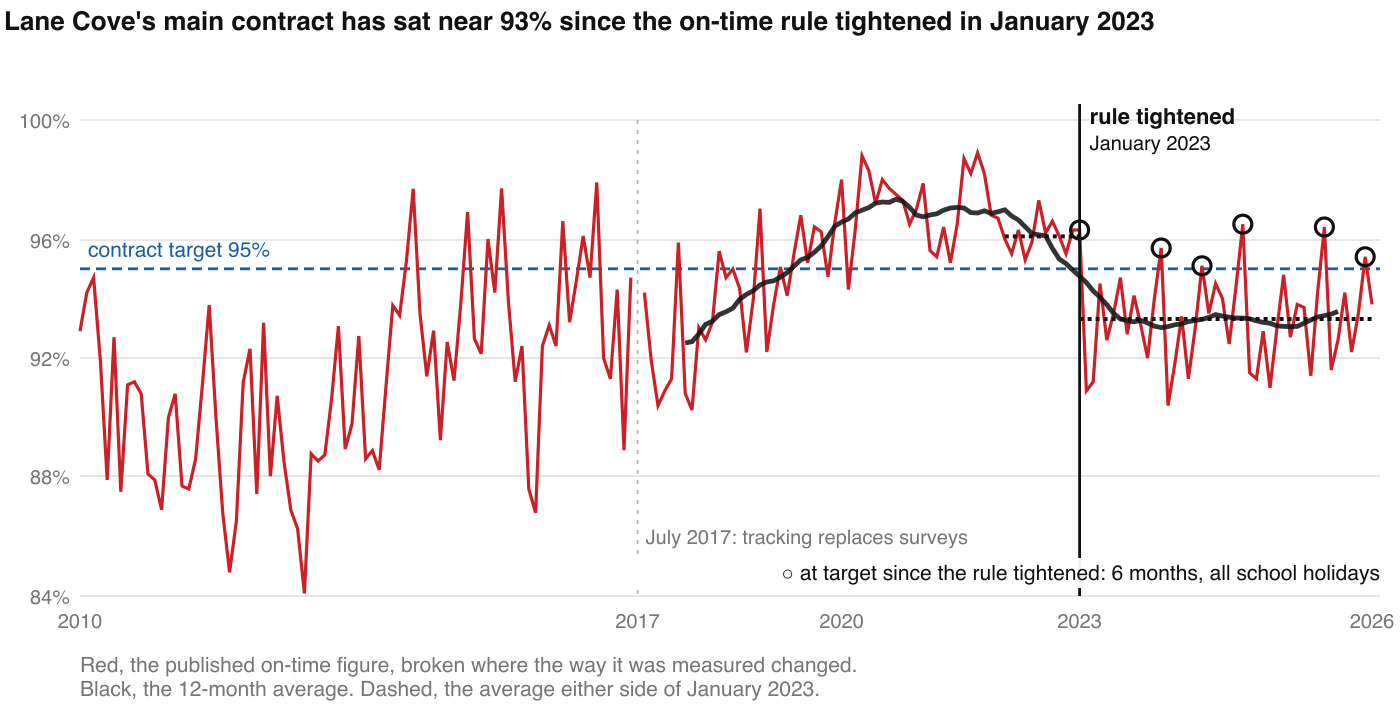
Region 7 has sat near 93% since, reaching the target in six months out of 44, all of them in the January or July school holidays.
Is it just Lane Cove?
No. On our count, lateness fell during COVID and came back, here and across Sydney.
In February 2020, weeks before the first lockdown, about one Lane Cove arrival in six was six minutes or more late. In February 2022 it was about one in 18, when, as the Auditor-General found, traffic and patronage were still low after the 2021 lockdown. By February 2024 it was back to about one in six, here and across the rest of Sydney, and it stayed there in 2025. (February runs later than most months.)
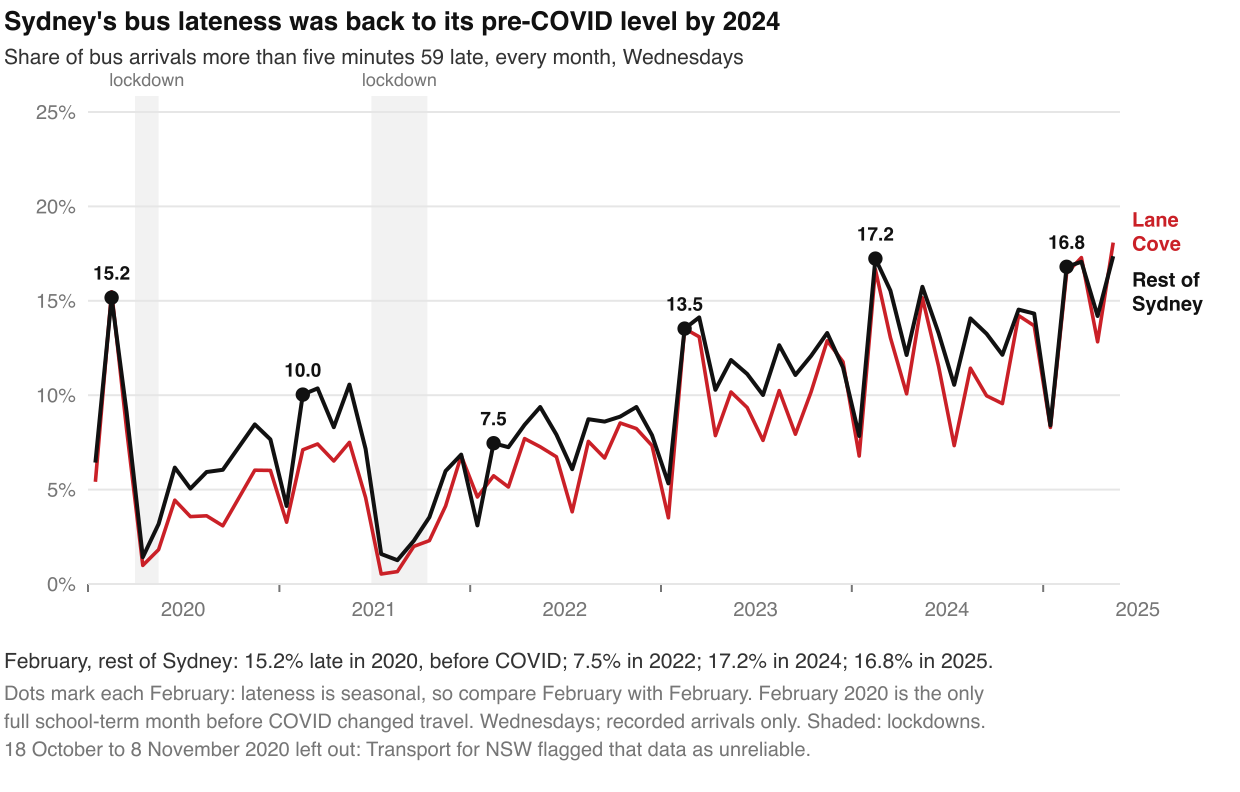
From 2023 to 2025 the late share rose about four points, here and across the rest of Sydney, taking both back to about where they were before COVID. Every one of Sydney’s ten contract regions got later. Between 5pm and 7pm, though, Lane Cove’s rose faster, nearly all of it in 2025; in the morning peak and late evening, a little more slowly.
Is it the traffic? Our data can show where the extra minutes appeared, but not why: slower traffic, longer stops for boarding, or tighter timetables would all look the same. Across Sydney, the record at each trip’s first stop showed buses about two minutes behind the timetable in both 2023 and 2025, so the extra delay built up after that.
About three-quarters of the extra delay a Lane Cove bus carried in 2025 was already on it when it reached its first Lane Cove stop. Transport’s statement below points to traffic, incidents, road works and passenger numbers.
What about the buses that never come?
Transport’s published cancellation rate covers Greater Sydney as a whole, with no breakdown by route, contract or suburb. It has sat at about one in 100 for three years.
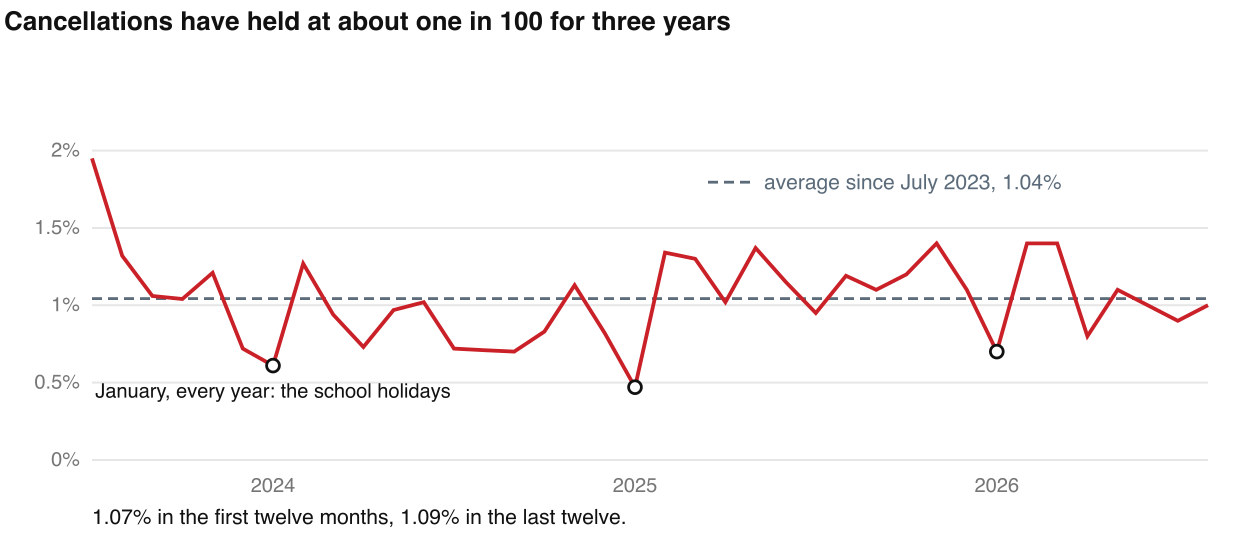
We have counted Lane Cove’s ourselves, from the public live feed that phone apps use. From 6 to 25 September 2026, 170 of the 17,044 scheduled trips that stop in Lane Cove were still flagged cancelled when we last saw them: 1.0%, or 0.7% to 1.3% allowing for day-to-day swings.
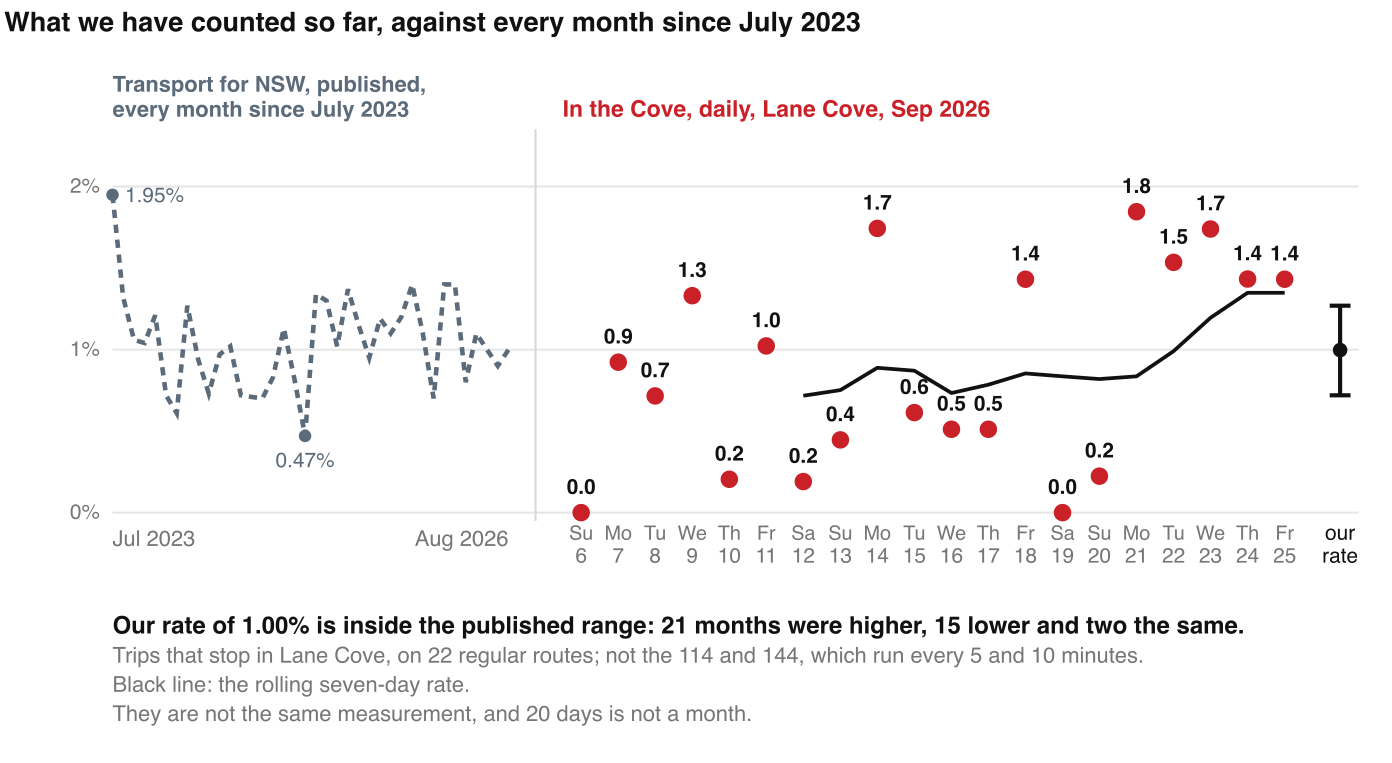
That count covers 22 of the 26 regular routes. We left out the 114 and 144, because on those routes the next bus is usually minutes behind. Counting them would raise the figure. The N90 and N91 night buses, which stop here only at St Leonards, are left out too.
Our 1.0% is about where Transport’s Greater Sydney rate has sat, though the two are counted differently: theirs at the first stop, over a month; ours from a flag in the live feed, over 20 days. No route stood out consistently enough to name, and we will keep counting.
What should change?
The monthly route reports already exist. Publishing them would release what Transport holds, not collect anything new, and let anyone in Sydney see how their own bus runs.
We also have a question for Transport, which can vary timetables under the contracts: do Sydney’s bus timetables still reflect how long the buses take?
Transport told the Auditor-General in January 2025 that it had adjusted services in regions including the North West and the Northern Beaches, “to better align timetables and routes with current travel patterns and passenger needs”.
It told In the Cove it “continues to review and improve services across the North Shore, including Lane Cove”. Publishing what those reviews find, route by route, would tell passengers how far to rely on the time at the stop.
How we counted
Unless we say otherwise, the figures here are our own count, not Transport for NSW’s official results or the figures operators are assessed on. For lateness we used Transport’s public Bus Opal Assignment Model, which records when each bus was due at each stop and when its tracking says it arrived, not Opal taps.
Transport’s published figure is taken as buses leave the first stop of each trip, and contracts are assessed at designated timing points; we scored arrivals at every stop, against the contract’s definition of on time.
Our late-September check read Transport’s live feed from 16 to 25 September on the regular routes except the 114, 144, N90 and N91: 9.9% of buses passing a Lane Cove stop were six minutes or more late, against 10.0% on the same routes over our recorded year, which included school holidays, so the two are not like for like. Those routes include the 612X; leaving it out does not change the September figure.
The 2023 to 2025 comparison with the rest of Sydney uses Tuesdays to Thursdays, February to May. Transport has told us our measures should not be treated as the same as its own, and we agree.
A bus can run while its tracking fails, so passengers cannot see it in real time and the data holds no arrival for it; the Bus Industry Taskforce called these ghost buses. We leave arrivals with no recorded time out, as Transport leaves untracked trips out of its own on-time figures. Every figure, and its limits, is in our spreadsheet: Lane Cove bus data (Excel).
Asked to respond
We put our findings in writing to Transport for NSW, Busways, Keolis Downer and Transit Systems before publication. In its first response, on 2 September 2026, a Transport for NSW spokesperson said:
“Transport for NSW is committed to transparent reporting of bus performance and publishes monthly bus performance reports and on-time running results.
Bus performance is publicly reported at the contract-region level rather than individual route reporting. This method aligns with the way bus services are contracted, managed and monitored across the network.
While route-level performance information is used extensively to monitor operators, manage contracts and inform service improvements, it is not currently published as part of Transport’s regular reporting.
It is important to distinguish between open data products and Transport’s official performance reporting. Official punctuality results are calculated using dedicated operational data sources and methodologies designed for contractual performance measurement.
Changes to open data products are documented through published metadata and should be considered when undertaking historical comparisons.
Transport for NSW continues to review and improve services across the North Shore, including Lane Cove, to ensure the network meets changing customer needs.”
On 25 September 2026, responding to an earlier draft of our article, a Transport for NSW spokesperson said:
“Transport for NSW has reviewed the analysis and notes that, while the article acknowledges the findings are not official performance measures, several conclusions are based on a methodology that differs significantly from the methodology used to assess contractual performance and manage operator performance.
Transport for NSW has previously advised that contractual performance reporting is based on designated timing points and established performance measures, which cannot be replicated using publicly available data sources. As a result, the article’s findings should not be interpreted as official performance results or as a direct measure of contractual performance.
While independent analysis of publicly available transport data can contribute to discussion about the network, care should be taken when drawing conclusions about operator performance from datasets that were not designed or intended for contractual performance measurement.
While punctuality is important, it is also integral to recognise that buses operate in real-world traffic conditions that can change significantly from one day to the next. Measuring services solely against a timetable does not capture the complexity of operating a high-frequency bus network on busy urban roads, where traffic congestion, incidents, road works and passenger volumes can all influence journey times. Despite these challenges, the vast majority of services continue to operate and connect customers with work, education and essential services every day.”
Asked about our method in August 2026, Busways told us the data we used “is not suitable for assessing on-time performance”. On-time performance, it said, “is assessed through cross-referencing a range of data sets on selected timing points, rather than standalone raw data using every stop”.
Keolis Downer and Transit Systems did not comment.
Over to you
Find your route in the table above or in our spreadsheet: Lane Cove bus data (Excel).
Which stop is the one where you have stopped trusting the timetable?
Is there a service you have given up on, or a change that would help?
Tell us in the comments on our Facebook or Instagram post, or write to us at [email protected]. With your permission, we will add the most useful answers, and the best arguments against us, to this article.
One board is one morning on one route. Next time you are looking at one like it, tell us the stop and what it says; enough of them, together, would start to show where the timetable holds.
This article was written by Anthony El-Khoury as an unpaid contributor. Data collection, analysis, and visualisations were completed with the assistance of AI, with all claims checked against the cited sources. The views expressed are his own and not those of his employer.
In the Cove delivers independent Lane Cove news every day — 100% free, with no paywall. Your support helps ensure Lane Cove continues to have a strong, independent voice.
Support In the Cove: ☕ Shout ITC a Coffee or ❤️ Contribute Any Amount or 📣 Advertise with Us
Sources:
- Bus Opal Assignment Model (Transport for NSW open data)
- Buses running on time (Transport for NSW)
- Buses, on-time running dataset (Transport for NSW open data)
- Greater Sydney and Outer Metropolitan Bus Service Performance Data (Transport for NSW open data)
- Public Transport Realtime Trip Update (Transport for NSW open data)
- Greater Sydney Bus Contract
- Greater Sydney Bus Contract, Schedule 4 (Key Performance Indicators)
- Greater Sydney Bus Contract, Schedule 5 (Governance and Reporting)
- Audit Office of NSW, Bus contracts in metropolitan Sydney, January 2025
- Transport for NSW, response to the Auditor-General, 28 January 2025
- NSW Legislative Assembly, Questions and Answers Paper, 14 March 2024 (Question 2369)
- NSW Bus Industry Taskforce, First Report, July 2023
- Transport for NSW, Annual Report 2024-25
- Transport for NSW, statements to In the Cove, 2 and 25 September 2026
- Transport for NSW, North West and Hills District bus changes, 21 June 2026: summary of routes
- Busways, response to In the Cove, 27 August 2026