
At a Glance
- Population: Lane Cove LGA has grown from about 30,200 in 1976 to an estimated 43,100 in 2025 — most of the growth concentrated in the apartment corridor, not the house suburbs.
- Two Lane Coves: Lane Cove village and Lane Cove North (62–71% apartments) hold just over half of LGA residents. The four house suburbs — Riverview, Longueville, Linley Point, Northwood — remain 92–99% standalone houses.
- Household size shrank: Average household size fell from 3.2 people in 1976 to 2.4 in 2021 — but it’s not even across the LGA: Lane Cove North sits at 2.3, Riverview still at 3.2.
- Religion flipped: “No religion” overtook Catholic as the LGA’s top response in 2016. By 2021 it was 40.3% vs Catholic’s 24.8%.
- Migration shift: Overseas-born residents rose from 18% (1976) to 41.9% (2021). China overtook England as the top overseas birthplace between 2011 and 2021.
- Fewer kids in the apartment corridor: Lane Cove North has just 0.26 children per young adult, versus 1.11 in Riverview — a four-fold gap within the one council area.
- Birth rates below replacement: All three ABS statistical areas covering Lane Cove sit below Sydney’s already-low 1.44 fertility rate, and well short of the 2.1 needed to hold population steady.
- Next wave already zoned: St Leonards South (old East Greenwich) will add roughly 2,000 apartments over the next decade — with no primary school committed for the precinct.
- Next Census: Tuesday 11 August 2026. First results expected mid-2027.
The next national Census will take place on Tuesday 11 August 2026. Before the 2026 Census, In the Cove thought it would be interesting to see how the Lane Cove LGA has changed over the last 50 years. We have taken a deep dive into the data – so grab a cup of tea and get ready to find out how our LGA has changed over the last 50 years.
We have relied on Australian Bureau of Statistics releases compiled at the LGA and suburb levels, back as far as the boundaries allow.
They tell a story that you don’t see in real estate flyers: Lane Cove is no longer one place. Across 50 years, it has stretched into a gradient, from suburbs of near-unbroken houses at one end to a corridor of apartment towers at the other, with genuinely mixed neighbourhoods in between.
The view from above: fifty years
Rewind to 1976, and the Lane Cove LGA was a different place:
- Population: about 30,200
- Flats or apartments: about 28% of dwellings
- Born overseas: about 18% of residents
- Average household: about 3.2 people
- Most common religion: Catholic
- Most common language at home: English, by a wide margin
(Pre-2001 LGA figures in this article are best-effort reconstructions on the modern boundary, drawn from ABS Historical Statistical Division publications; the post-2001 figures are direct from each census’s QuickStats release.)
Lane Cove LGA Population
Today, after a dip through the 1980s (down to about 27,900 by 1986) and a flat 1990s, the LGA’s population has been climbing:
- 2001: 30,340
- 2006: 30,427
- 2011: 31,510
- 2016: 36,051
- 2021: 39,438
- 2025: about 43,100 (latest ABS estimate)
Most of the post-2011 climb is concentrated in the village core and Lane Cove North, the suburbs where the LGA’s apartment construction boom was initially concentrated; the four house suburbs (Riverview, Longueville, Linley Point and Northwood) are fully built-out residential streets with effectively no apartment stock.
However, not in the next 50 years, but in the next five years, our LGA will be very different with the construction boom in the St Leonards South Area.
Fifty years, one council boundary
Over the same fifty years, the dwelling mix has shifted from mostly houses to mostly apartments, the share of residents born overseas has more than doubled, and the LGA’s most common religious response in the census has flipped from Catholic to no religion. Each of those shifts has a sharper edge at the suburb level, where the same fifty years played out very differently from one end of Lane Cove to the other.
The eight Lane Coves
The Lane Cove LGA officially has nine suburbs: the eight profiled below, plus a slice of St Leonards on its eastern edge (about 2,600 residents at the 2021 Census, and growing fast as St Leonards South builds out). A couple of older names also still cling to that eastern edge near the Pacific Highway. Osborne Park was a locality in its own right until 1999;
East Greenwich is the pocket now being rebuilt as the St Leonards South apartment precinct.
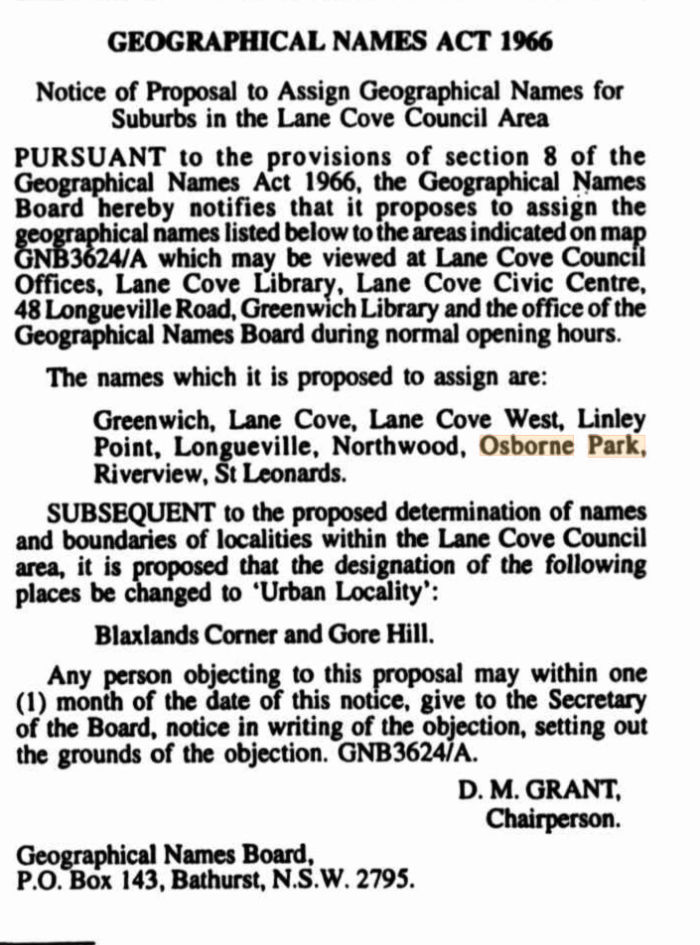
Fri 22 Sept 1995 [Issue No.116]
Click any suburb on the map; pick a year
8,000+
Two suburbs are the urban heart:
- Lane Cove, the village around the shopping centre: 12,363 residents, median age 38, $2,539 a week, and 62% of dwellings flats or apartments.
- Lane Cove North, a near mirror image at scale: 11,773 people, median age 36, 71% flats or apartments, plus the highest born-overseas share in the LGA (47%).
Between them, these two suburbs hold just over half of the LGA’s residents and most of its apartment stock.
Compare the above with Lane Cove West and Greenwich:
- Lane Cove West (3,146 people, median age 37) between 2016 and 2021 houses were knocked down and the number of apartments rose from 23% to 36%, much of it along Burns Bay Road, as its population grew by nearly a fifth.
- Greenwich (5,469, median age 42) is stable, and has been for years: roughly half stand alone house on the peninsula, with apartments concentrated along Greenwich Road, a mix that held steady between 2016 and 2021.
Riverview, Longueville, Linley Point and Northwood between them have a population of around 6,500 residents, but most residents live in a stand alone house:
- Linley Point: 99.2%
- Longueville: 98.8%
- Riverview: 97.5%
- Northwood: 92.7%
Around half of all dwellings are owned outright and the rented share sits below 12%.
That is the eight-suburb picture in 2021. The interactive map above lets you click between them.
The spread, in one screen
Religion, ancestry, family; How Has That Changed?
Religion
Between the 2001 and 2021 censuses:
- No religion: up from 17.1% to 40.3%
- Catholic: down from 29.4% to 24.8%
- Anglican: down from 20.7% to 10.2%
The shift is not unique to Lane Cove; it tracks with most of metropolitan Sydney. The speed is what stands out. The 2016 Census was the first in which “no religion” (32.0%) overtook Catholic (26.9%) in the LGA, and by 2021 the gap was wider than the entire Anglican share.
The “no religion” answer is strongest in Lane Cove North (43%) and Greenwich (43.5%), Catholicism is still the number one religion in Riverview 43%, Longueville 38%, Linley Point 36%. This may not surprise many people, given Riverview and Longueville's proximity to St Ignatius College Riverview, with families wanting to be located near schools.
Northwood is the exception in that group, with no religion (38%) ahead of Catholic (27%).
Ancestry
The census figures reveal that the percentage of Lane Cove residents born overseas:
1976: about 18%
1991: about 26%
2001: 29.3%
2011: 36.8%
2016: 40.9%
2021: 41.9%
In 2001, the top three places where Lane Cove residents were born overseas were:
England - 5.0%
New Zealand - 2.7%
China - 1.9%
By 2011 China had moved into second place ahead of New Zealand.
By 2021, the top three places where Lane Cove residents were born overseas were:
China - 4.9%
England - 4.6%
India - 2.7%
Chinese ancestry now sits at 14.1% LGA-wide, third behind English (28.5%) and Australian (24.3%).
Language
Mandarin became the most-spoken non-English language at home between the 2011 Census (when Cantonese still led, at 3.1%) and the 2016 Census (Mandarin 4.7%).
By 2021 Mandarin was 5.6% and Cantonese 3.6%.
Family Dynamics
The LGA’s average household held about 3.2 people in 1976 and 2.4 at the 2021 Census.
Couples-with-children used to be the default. Today the family-household mix is more even:
- Couples with children: Nearly 50%
- Couples without children: 40%
- One-parent families: 11%
This means that roughly one in four households is now a single person living alone.
Lane Cove North has the lowest people-per-dwelling figure in the LGA (2.3), the highest single-person share (31.8%) and a renter share of 39.9% (second only to Lane Cove West at 44.3%). It's the youngest, most transient corner of Lane Cove.
Drag the slider through fifty years of Lane Cove
What Do Lane Cove Locals Do For a Living?
In 2011 the LGA-wide share was 41.0% Professionals and 18.5% Managers.
By 2021 those numbers were 43.5% and 21.1%.
The rest of the workforce splits across:
- Clerical and Administrative, 11.9%
- Community and Personal Service, 6.2%
- Sales, 6.1%
- Technicians and Trades, 5.9%
- Labourers, 2.5%
- Machinery Operators and Drivers, 1.2%
How Lane Cove earns its money, and how that has shifted
The industries employing those residents in 2021 read like a cross-section of corporate Sydney:
- Computer System Design and Related Services, 5.3% of the LGA workforce
- Hospitals, 5.1%
- Banking, 3.7%
- Auxiliary Finance and Investment Services, 3.1%
- Legal Services, 2.8%
It was the same breakdown a decade earlier.
Twenty years ago, in 2001, ABS used a much broader “Business Services” bucket that captured most of these as one category at 14.3% of the workforce, so a like-for-like comparison further back is rough; the direction (away from production and toward professional services) is the same.
The four house suburbs all report Manager shares between 24% and 26%, the LGA’s highest. The apartment corridor (Lane Cove village and Lane Cove North) runs lighter on Managers (19-21%) and steady on Professionals (around 43%); Lane Cove West and Greenwich sit in between.
The top industry varies by suburb in revealing ways. Lane Cove, Lane Cove North and Lane Cove West all have Computer System Design as their #1 sector (5.4% to 6.4% of each suburb’s workforce).
Greenwich has the LGA’s highest concentration of Hospital workers at 7.0%, probably reflecting medical specialists living within reach of Royal North Shore Hospital; Longueville and Riverview lead with Hospitals too. Linley Point sits in a distinct pocket: Legal Services (5.2%) and Dental Services (4.7%) lead. Northwood’s top industry is Auxiliary Finance and Investment Services (6.0%): a small, finance-heavy enclave.
The factories that came before
There is almost no trace of the older Lane Cove left in those numbers. Manufacturing, Machinery Operators and Drivers, and Agriculture together account for less than 4% of the 2021 workforce. Trades stand at 5.9% LGA-wide, heaviest in Lane Cove North (7.2%), Lane Cove West (6.9%) and the village (6.0%), plausibly tradies serving the construction wave; three of the four house suburbs (Riverview 3.3%, Longueville 3.7%, Linley Point 1.6%) sit well below 4%.
The river edge and the western flats once carried real industry:
- Rupert Kirk’s soap and candle works, the earliest factory in the district, from the 1830s.
- The Burns Bay tanneries, run by Ludowici and Radke from 1858; Ludowici did not stop tanning until 1967, and made leather factory-belting beside it, as Mangrovite Belting, until 1974.
- The Australian Wood Pipe Company, turning out wooden water pipes from 1914, and the Phoenix and Sydney potteries, firing teapots and Toby jugs in the 1880s.
- Festival Records, whose national head office, pressing plant and recording studios sat in Lane Cove West from the mid-1950s.
- Columbia’s pencil factory on Mowbray Road West, from 1954, then the largest factory in the area.
- The Mars Road industrial estate, which opened in 1960 with a margarine maker and filled, through the 1970s, with electronics and computer firms.
- The plant Lane Cove was proudest of: the Life Savers confectionery factory on Mars Road, which its 1963 annual report called the most modern confectionery plant in the Southern Hemisphere, and where local Salvatore Nicotra, whose 90th birthday In the Cove marked in 2024, was one of the first to help make Quick-Eze.
One by one those works closed or moved on, and the ground they stood on became apartments and business parks. Lane Cove is now set to become a data centre cluster, with five data centres either operating, approved or in the planning system. The current AirTrunk data centre is expanding and has purchased the site next door.
Where the children went, and what density did with them
The Lane Cove Village and Lane Cove North has younger residents, fewer children per young adult, more renters, more recent migrants, and lower household incomes. The house Lane Cove (the four house suburbs) is the inverse on each one of those measures.
The cleanest single number for this is the ratio of children aged 5-14 to adults aged 25-44, a rough lifecycle proxy for “are families forming and staying here?” Ranked from fewest children per young adult to most:
- Lane Cove North: 0.26
- Lane Cove 0.36
- Greenwich and Lane Cove West: around 0.46
- Linley Point: 0.89
- Northwood: 1.01
- Longueville: 1.10
- Riverview: 1.11
The four house suburbs have roughly two to four times the children-per-young-adult of the apartment corridor.
Each dot is one of Lane Cove's eight suburbs in 2021
The numbers don’t say anyone is choosing wrong. The apartment corridor is full of dual-income couples in their late twenties and thirties, often before kids or with one or two small ones, drawn here by the village proximity and the being close to the CBD.
The house suburbs are full of families who bought into a four-bedroom in their late thirties and stayed put. The dwelling shapes the household that fits inside it, and the household shapes who can afford to be there next.
What the numbers do say is where Lane Cove’s next decade of children are most likely to grow up. The four house suburbs together hold 17% of the LGA’s residents yet they have the highest children-per-young-adult ratios.
The apartment corridor will keep being a destination for younger people moving to the LGA, most of them without children when they arrive; many of those who form families will need somewhere with more bedrooms than a one- or two-bedroom flat.
The births that aren’t happening
The Sydney Morning Herald recently published an article noting that births across Sydney fell to a 20-year low of 58,122 in 2024, and the fertility rate, the number of children a woman is expected to have, dropped to 1.44. That is down nearly a fifth in a decade and well short of the 2.1 needed to hold a population steady. Greater Sydney’s annual births peaked in 2018 and have fallen every year since.
The Sydney Morning Herald's data is based on the ABS statistical areas rather than individual suburbs, and three of them cover the Lane Cove LGA. All three sit below the Sydney average:
- The neighbourhood around the village: 1.39
- The area spanning Greenwich and Riverview: 1.24
- The area taking in Lane Cove North: 1.14
None is close to the 2.1 replacement rate. Because these areas straddle our suburb boundaries, they are a coarser cut than the census numbers above, but the direction matches the children-per-young-adult ratios exactly.
Lane Cove's birth rate already trails Sydney's
The Sydney Morning Herald article quoted KPMG urban economist Terry Rawnsley who said the cost of housing was “locking young couples, those most likely to have children, out of many parts of the city”. Australian National University demographer Professor Edith Gray described the inner-urban pattern of high incomes, high education and long hours as “not really the setting to be having large numbers of children”.
In the 2021 Census, 48% of Sydney women aged 30 to 34 had never had a child, up from 42% a decade earlier.
The article drew the local consequence plainly: fewer births mean “school enrolments will fall, and some schools will close or merge”.
The first half of that sentence has already reached Lane Cove. The children not being born in the apartment corridor today means fewer kindergarten enrollments in 2031.
The apartment corridor now driving those low birth numbers is itself a recent creation. The flat-or-apartment share of LGA dwellings climbed in jumps, not a straight line:
- 1976: about 28%
- 1996: about 42%
- 2001: 43.6%
- 2011: 43.6% (a decade-long plateau)
- 2016: 51.6%
- 2021: 56.7%
Almost the entire post-2011 shift sits along two apartment belts: the Mowbray Road corridor in Lane Cove North, which filled in fastest between 2011 and 2016, and the village core and the Pacific Highway side of the Lane Cove suburb itself, south of Epping Road, which took the largest single share of recent growth.
The next wave is already zoned: the St Leonards South precinct, the old East Greenwich pocket, is set to add roughly 2,000 apartments on the Lane Cove side of the highway over the coming decade. However the NSW Government has decided not to plan for a primary school in this area.
In 2025 ITC asked NSW Schools Infrastructure to provide an update on their plans for a school in St Leonards. A Department of Education spokesperson told ITC the following:
“Planning is continuing for a potential future school at St Leonards. The Department of Education is working closely with the Department of Planning, Housing and Infrastructure to ensure growth is catered for in the area around the Crows Nest Transport Oriented Development, and the community will be kept updated as this work continues.
Currently, there is sufficient capacity at existing primary schools in the St Leonards area and surrounds. Over the past decade, more than 10 public schools in the Chatswood, St Leonards, Willoughby and North Sydney area have been upgraded, which have added capacity for 6,700 more students.”
Apartments and overseas-born share, every census 1976 to 2021
What About Our Neighbouring LGA's?
The LGAs around us tell their own versions of the same story, and Lane Cove sits in a recognisable cohort.
- Hunters Hill (13,559 people, median age 46, 22% apartments) is a smaller, older, more house-dominant version of the same demographic. It is also what the Herald calls a “tombstone suburb”, one of the roughly one in eight Sydney neighbourhoods where deaths now outnumber births: in 2024 it recorded 104 more deaths than births.
- North Sydney (68,950, median age 38, 76% apartments) is the trajectory pushed to its conclusion: three of every four dwellings are apartments and one in ten is a separate house.
- Willoughby (75,613, 49.5% born overseas) is the same demographic a decade further along the migration curve.
- Mosman (28,329, $2,892 a week, 52% apartments, 38% owned outright) is an older, more anglicised version.
- Ryde (129,123, 52.5% born overseas, Chinese 26%) is the LGA Lane Cove will most resemble by 2031.
None of these neighbours has dissolved its own apartment-versus-house split. North Sydney has pockets of single-family streets between its towers; Mosman’s foreshore mansions sit beside its Spit Junction flats; Willoughby’s Chatswood urban-renewal precinct is bracketed by Castlecrag and Northbridge.
What is unusual about Lane Cove is the sharpness of its split inside one small council. Eleven square kilometres, nine suburbs, and a median household income gap of roughly 2× from Lane Cove North, $2,386 a week to Northwood, $5,012 a week.
What Will the 2026 Census Probably Show?
The 2026 Census will be the first to fully capture the post-pandemic re-arrangement of Sydney living, the post-2022 immigration recovery, the apartment completions delivered across the village and Lane Cove North between 2017 and 2024, and the early effect of the NSW transport-oriented development rezonings. A few things look likely:
- The resident population, around 43,100 at 30 June 2025, will almost certainly set a new high, with most of the net growth in the apartment corridor.
- The “no religion” share, already 40.3% in 2021, may approach half of all LGA-wide responses.
- Chinese ancestry, at 14.1% in 2021, looks likely to climb further.
What the 2026 Census will not tell us is whether the youngest cohort in the apartment corridor (the late-twenties professionals who arrived between 2018 and 2024) will stay long enough to form families locally, or whether they will follow the export pattern of the previous decade’s arrivals, settling further out by their late thirties. That answer will be in the 2031 census data.
The 2026 numbers will tell us how many of them are still here, how many young children sit in the LGA’s primary schools, and where the demographic centre of gravity has moved next.
When the first detailed releases land in mid-2027, we’ll publish what they show here.
The full dataset behind this article, every figure broken down by suburb and census year, is available as a downloadable spreadsheet.
This article was written by Anthony El-Khoury as an unpaid contributor. Data collection, analysis, and visualisations were completed with the assistance of AI, with all claims checked against the cited sources. The views expressed are his own and not those of his employer.
Why Local News Matters
In the Cove delivers independent Lane Cove news every day — 100% free, with no paywall. We write for the community, from within the community. We are a proud member of LINA — the Local & Independent News Association, which supports small, independent publishers serving their communities with reliable, accountable local journalism. Local news strengthens community connection, keeps residents informed, spotlights issues that bigger outlets overlook, and holds local decision-makers accountable. When local news disappears, communities lose transparency, trust and shared understanding. Your support helps ensure Lane Cove continues to have a strong, independent voice.
Support In the Cove
☕ Shout ITC a Coffee.
❤️ Contribute Any Amount.
📣 Advertise with Us.
Sources: ABS 2021 Census QuickStats SAL-level for Lane Cove, Lane Cove North, Lane Cove West, Greenwich, Riverview, Longueville, Linley Point, Northwood. LGA-level QuickStats for Lane Cove, Hunters Hill, Willoughby, Mosman, North Sydney and Ryde. Time-series LGA QuickStats: 2001, 2006, 2011, 2016. ABS Regional Population (3218.0) for the latest Estimated Resident Population. Sydney-wide fertility and birth figures from the Sydney Morning Herald’s “Sydney, where have all the babies gone?” (Matt Wade, 28 May 2026), drawing on ABS Births, Australia; the Lane Cove school-enrolment trend is from our earlier report. Industrial-history details are drawn from the Dictionary of Sydney, the 1987 “Industrial Heritage of Lane Cove” study held by the University of Sydney Library, and, for the Life Savers plant, In the Cove’s 2024 profile of Salvatore Nicotra. Pre-2001 LGA-wide figures are best-effort reconstructions on the modern boundary, drawn from ABS Historical Statistical Division publications; the post-2001 figures throughout are direct from each census’s QuickStats release linked above. The full dataset behind this article is available to download as a spreadsheet.